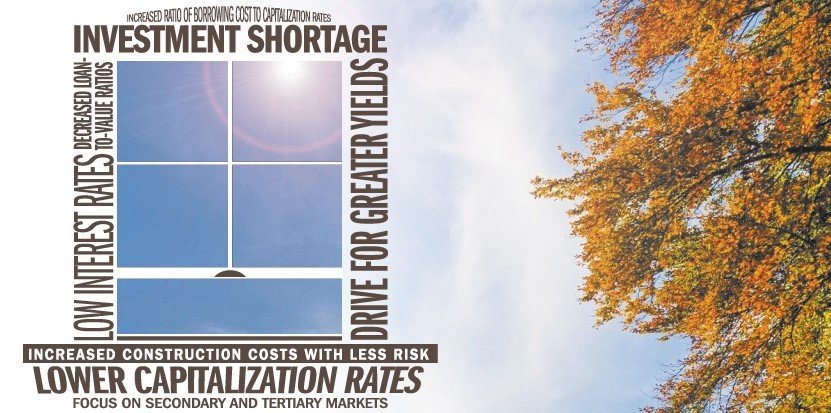
2016 was another strong year for investment sales in the Omaha area, with strength across all product types and price ranges. Some of the more notable transactions include the sale of the L Street Marketplace Shopping Center ($42.6 million), The Metro Crossing Shopping Center in Council Bluffs ($44.3 million) and the Legacy Commons apartment complex ($26.5 million). In my opinion, the year was characterized by a shortage of quality product, reflected in capitalization rates that are slightly lower than in 2015.
There are two drivers of this. The first is the global drive for yield prompted by historically low interest rates. This has been lowering returns for years and forcing investors to become increasingly aggressive. The second trend is the shifting of the investment focus of national buyers from primary markets to secondary and tertiary markets. This is a familiar pattern. At the beginning of a real estate investment boom, institutional activity is focused on primary markets. Competition in these markets then drives down returns, which forces the focus to secondary markets and, eventually, to tertiary markets.
Omaha has benefited from this second trend, as investors are attracted to its steady and stable economy, low unemployment rate and pro-business environment. If property is priced properly in Omaha there will be a large pool of buyers for quality assets.
Many market participants compare the current market to the previous market that ended in 2007, and are asking if we are on the cusp of a major correction. However, there are some significant differences between today’s market and the previous boom:
THE SPREAD BETWEEN BORROWING COSTS AND CAPITALIZATION RATES – In the previous bull market, interest rates locked for ten years were in the high 5 percent to low 6 percent range. Comparable interest rates are currently in the mid 4 percent range, approximately a 150-basis point difference. Capitalization rates are roughly equivalent to those in the previous boom, therefore the spread between borrowing costs and capitalization rates is significantly higher.
THE SPREAD BETWEEN BORROWING COSTS AND THE TEN-YEAR TREASURY – On January 1, 2007, the 10-year Treasury rate was 4.76 percent, with 10-year borrowing costs in the high 5 percent to low 6 percent range. That was a spread between 100 and 150 basis points to the lender depending on the property specifics. The 10-year Treasury rate as of this writing is approximately 1.8 percent, with 10-year borrowing costs being in the mid 4 percent range. That is a significantly higher spread to lenders, and allows some “room” for the 10-year Treasury to rise without significantly impacting borrowing costs.
UNDERWRITING STANDARDS AND LOAN TO VALUE RATIOS – My personal experience has been that buyers are significantly more cautious in their underwriting, and loan-to-value ratios are lower. It is very common to see equity contributions of 35 percent to 40 percent on new purchases, especially with multi-tenant property. Today’s deal structures are generally less risky than in 2007.
NEW CONSTRUCTION COSTS – New construction costs have increased notably compared to what they were in the last market cycle. In my opinion, this is a game changer. Existing properties have much less to fear from new projects because rents for new product will have to be significantly higher in order to justify the project. This places existing properties in a much better competitive position, even if significant dollars need to be invested for renovation and re-tenanting.
In summary, the last market peak had all of the hallmarks of a speculative mania. The current strong market, in my opinion, is a logical and rational reaction to a long period of low interest rates and the lack of alternatives to obtain yield. While a correction would be normal at some point, I think it would take a sudden jump in interest rates or a significant economic downturn to derail the current bull market in investment property.
 BY EMBER GRUMMONS, CCIM
This article appeared in our quarterly newsletter from December of 2016. The full newsletter is available at http://files.investorsomaha.com/download/online_newsletter_12_2016.pdf

