2016-2019 OMAHA MARKET SNAPSHOT
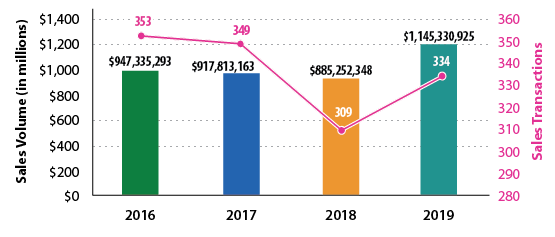
Investors Realty created its own database of commercial real estate sales greater than $500,000 back in 2004. The following graphs highlight a few of the existing market trends we are seeing in the greater Omaha area. Overall, the amount of capital being invested in Omaha has increased since 2016 across the board. The number of building and land transactions has slightly decreased, but we are seeing larger transactions taking place.
BUILDING TRANSACTIONS Sales Volume & Number of Transactions
- Total Sales Volume increased 18% in 2019 with over $868,000,000. Increases in both Multifamily and Commercial transactions were the primary cause of this increase.
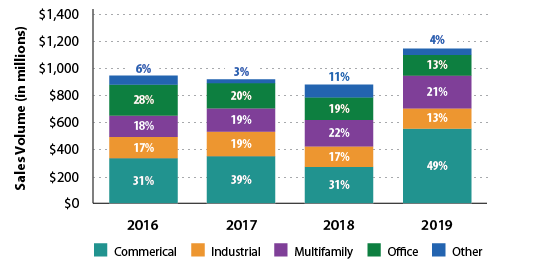
SALES VOLUME BY SECTOR
-
Commercial and Multifamily Sales Volume lead the Omaha market share in 2019. There was a decrease in Office Sales Volume due to lack of available product, and an increase in demand for Multifamily and Commercial investment property have caused this shift.
-
Multifamily Sales Volume has increased 25% from 2018 to 2019, and steadily risen since 2016. This is consistent with national trends.
-
Commercial Sales Volume increased 60% over 2018. This increase is likely due to low interest rates and high demand for investment product.
-
Industrial Sales have steadily decreased over the past few years from 70 transactions in 2016, to 51 transactions in 2019. This is due in large part to lack of available product on the market.
Office Sale Transactions have been fairly steady from 2016 to 2019, between 40-56 transactions per year. However, total sales volume has steadily dropped from 2016. Again, this is due to a lack of available product on the market.
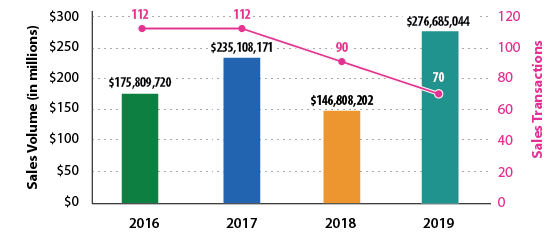
LAND TRANSACTIONS Sales Volume & Number of Transactions
- Total Land Sale Transactions decreased over 22% in 2019. However, total sales volume increased 88% showing more demand for future large-scale projects.
*Commercial Sales over $500,000
This article appeared in our company newsletter in March of 2020. Please click here to download the entire newsletter.


