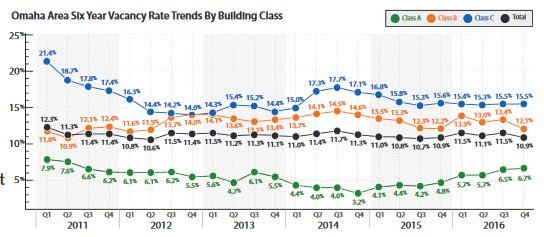
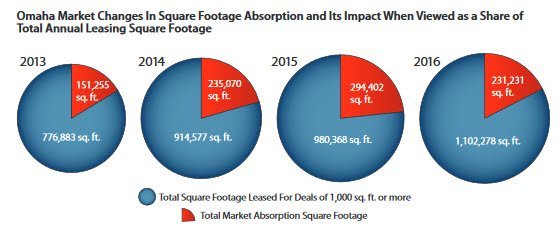
Omaha’s office market experienced the robust year we predicted for 2016, with 148 transactions and 1.1 million sq. ft. of space leased. The overall market also saw 231,231 sq. ft. of positive absorption. However, due to a significant increase in vacancy in the Downtown Submarket and a big decrease in vacancy in northwest Omaha, the overall vacancy rate stayed nearly flat at 10.9 percent. While plenty of momentum remains in the Omaha office market in 2017, individual results will be varied depending on the submarkets and classes of space involved in transactions.
Below are some highlights from our recently-released Office Market Report. To access the full report, please visit www.investorsomaha.com.
Omaha’s Class A vacancy rate is healthy at 6.7 percent and new construction is planned in parts of the city. There are more exciting build-to-suit options available than ever before with Aksarben and the West Dodge Corridor getting looks from virtually every active upscale office user.
In the Northwest Submarket, the vacancy rate decreased from 16.5 percent in 2015, to just 4.2 percent at the end of 2016 due largely to activity in the North Park office park. The sale of two North Park buildings is featured in this newsletter.
The vacancy rate in downtown Omaha grew from 10.1 percent in 2015, to 13.9 percent by the end of 2016. This rate, higher than the area has seen in years, resulted primarily from the 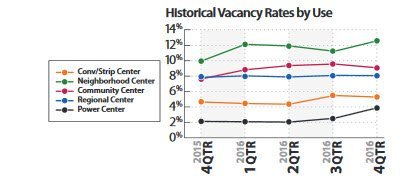
Downtown is a cause for concern, however, we believe this submarket offers significant opportunity and will be fertile soil for Omaha’s next crop of big companies and entrepreneurial companies. These companies often seek an urban environment. It may take a few years for downtown Omaha to return to a more normal vacancy rate, but we expect to see some exciting activity in its more significant vacant spaces.
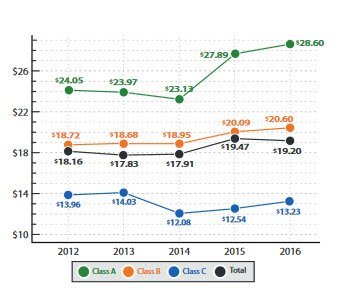
Asking rental rates across the market saw only a slight increase of $.02 psf on average in 2016, but more is going on than is revealed in the overall figures. The massive leasing of quality space in the Northwest Submarket pushed down the average asking rental rate for the remaining space. The small Northeast Submarket saw a quality former ConAgra space come on market, which increased the average asking rental rate nearly $5.00 psf. Rates are also up notably in Regency and Miracle Hills, but down slightly in the Suburban West Dodge and Southwest submarkets, primarily as the result of space in some of those markets’ older buildings coming available. A common theme in asking rental rates is the impact of new construction, seen mostly in Class A.
Net absorption for the overall market for 2016 was 231,103 sq. ft., which tracks with the market’s ten-year average. Suburban Omaha experienced 481,593 sq. ft. of positive absorption, while downtown Omaha experienced 250,490 sq. ft. of negative absorption. The Northwest, South Central, and Midtown submarkets dominated the lease market with positive absorption of 191,749, 132,432, and 108,866 square feet respectively. How Does Omaha Compare Nationally?
We compared Omaha to six other Midwestern markets of similar size. Omaha’s low overall vacancy rate puts the city in third place for that category, and Omaha ranks second behind only Madison for Class A vacancy. Omaha had led in Class A vacancy for several years, and the higher rate in 2016 reflects new construction in Omaha.
Overall, Omaha’s office market compares favorably to other markets of similar size. We have no concerns at this time and we believe Omaha is well-positioned to continue to grow and thrive.
This article appeared in our quarterly newsletter from March of 2017. The full newsletter is available at http://files.investorsomaha.com/download/IR_newsletter_March_2017.pdf

